
Flowcharting is a tool for analysing processes. It allows you to break any process down into individual events or activities and to display these in shorthand form showing the logical relationships between them. Constructing flowcharts promotes better understanding of processes, and better understanding of processes is a pre-requisite for improvement.
Examples of processes are “Receiving orders and entering them into the computer system” or “Converting dry-mix powder into tablet form” or “Following-up sales enquiries”. The events which make up a process, and which appear in the flowchart, may be of any type. For example, they may be “taking a phone call”, “completing an order form”, “printing a report”, “deciding between a number of alternatives”, and so on. The symbols used to represent each event may take any form. They may be boxes, circles, diamonds or other shapes, or events may simply be described in words. Connections between events are always represented by lines; usually with arrowheads to show the direction or order in which they occur. These lines represent the flow of activity in the process being described; hence the name of the technique.
There are specialised applications for flowcharting (such as in computer systems design and programming, engineering, and science) which use standardised sets of symbols. You must decide for yourself whether these need to be used in your particular management application. In most circumstances this will either not be necessary or you can rely on three or four simple symbols to cover most types of events. A useful set of symbols is given in the ‘How to use it’ section below. For special standardised symbols, see the ‘Other references’ section of this document for sources you can refer to.
Flowcharting to help clarify what actually happens or needs to happen
Organisational activity involves many separate tasks. These are often complex and they change over time in response to new customer demands, new product and service requirements, or new laws and regulations. These changes are often made in isolated, reactive and piecemeal ways, which are not necessarily best for the company or the people doing the work. In addition to external pressures for change, there is a constant need to search for new and better ways to do things in order to maintain a competitive edge, and to make life easier and more interesting for those who do the work.
The only way to control change, rather than have it control you, is to clarify what actually happens and to decide whether this is the way you want it or not. By grouping tasks into logical areas of activity (processes) and drawing flowcharts of the events which occur, it is possible to get a concise picture of the way particular processes are completed within the organisation. This makes it easier for you to move on to the next logical step which is to make changes for the better. This is because the flowcharting exercise will point you in the right direction to collect and analyse relevant statistics, examine other processes which relate to the one flowcharted, and pursue critical policy or procedure problems.
Flowcharting, as a tool for clarifying situations and thus improving knowledge and understanding, is particularly useful when used by a group or team. This is because by drawing a flowchart together, the team,
- develops a common understanding of the situation
- contributes a larger pool of knowledge than an individual can (assuming team members are well chosen for their knowledge and experience)
- can agree a common approach to solving problems, resolving ambiguities and making improvements
Team leaders will find that drawing a flowchart progressively on a whiteboard or flipchart, as team members contribute their information, opinions and ideas, will not only identify problems and areas of confusion, but will automatically build consensus and commitment by focusing the team’s attention on a single shared view of their task. Be warned, however, that while flowcharting looks easy to do, it takes practice to use effectively. It forces users to identify process steps so that they are clear and logical, which is of course its principal purpose.
Flowcharting to help communicate what actually happens or needs to happen
After taking stock of a process by flowcharting it, the final form of the flowchart (which should describe the process clearly and unambiguously) can then be used to communicate to others. Communication of processes is important for two reasons,
- people who are new to particular processes need to learn them and be able to refer to information about them
- the organisation benefits considerably from standardised processes and these must be clearly communicated to be effective
Flowcharts can either be distributed unchanged to communicate processes, or they can be used to help prepare logically structured and clearly written policies and procedures.
How to draw a flowchart
There are no hard and fast rules for constructing flowcharts, but there are guidelines which are useful to bear in mind. Here are six steps which can be used as a guide for completing flowcharts.
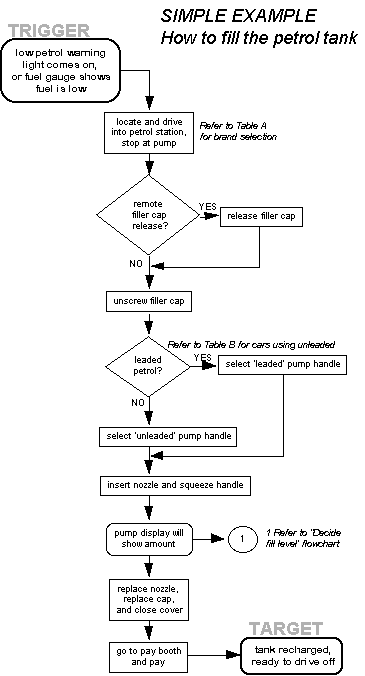
- describe the process to be charted (this is a one-line statement such as, “How to fill the car’s petrol tank”)
- start with a ‘trigger’ event
- note each successive action concisely and clearly
- go with the main flow (put extra detail in other charts)
- make cross references to supporting information
- follow the process through to a useful conclusion (end at a ‘target’ point)
The best way to illustrate the use of these guidelines is to look at a simple example (see below) and follow how each step has been applied.
- The first step is to identify the process to be flowcharted and to give the chart a title. In this case, it is `How to fill the car’s petrol tank’.
- Begin to draw the chart by first describing the event which initiates the process (the ‘trigger’). In the example this is `Low petrol warning light comes on’.
- Then note down each successive action taken. Actions should be described in as few words as possible, but make sure the description is not ambiguous or unclear.
- When you reach a point at which the flowchart branches into a number of alternatives, and the resulting complexity threatens to overwhelm the exercise, choose the most important alternative to continue flowcharting with. The others can simply be terminated and dealt with in separate flowcharts. Such a point is illustrated in the example where a decision is required on how much petrol is to be put in the tank.
- Often you may need to make cross-references to important supporting information (in this example cross references may be made to, say, a table of preferred brands of petrol, or to a list of cars able to use unleaded petrol).
- Continue describing each event, action or decision as it occurs in sequence, until the process is concluded. In the example, this point is reached when the petrol is paid for, the tank is recharged, and you are ready to drive off.
Flowcharts help to identify all the key tasks involved and the finished chart can be used:
- as a springboard for further discussion of the process
- to connect with other flowcharts explaining related activities
- to identify points where data can be usefully collected and analysed
- to isolate possible problem areas
- to communicate the process to those unfamiliar with it
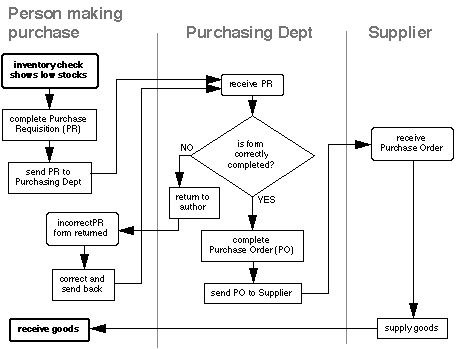
Tracking ‘handovers’
When a flowchart describes a process in which a number of different people, departments, or functional areas are involved, it is sometimes difficult to keep track of who is responsible for each step. A useful additional technique for tracking this, and for analysing the number of times a process is ‘handed over’ to different people, is to divide the flowchart into columns. Head up each column with the name of the person or function involved in the process, and each time they carry out an action show it in their column. This is illustrated in the flowchart below which covers a simple purchasing process. It shows how control of the process passes from the person initiating the purchase, to the Purchasing Dept. and then to the Supplier.
A set of useful standard symbols
It is not strictly necessary to use boxes, circles, diamonds or other such symbols to construct a flowchart, but these do help to describe the types of events in the chart more clearly. Described below are a set of standard symbols which are applicable to most situations without being overly complex.
![]()
![]()
Rectangle or box – use it to represent an event which is controlled within the process. Typically this will be a step or action which is taken. In most flowcharts this will be the most frequently used symbol.
![]()
![]()
Diamond – use it to represent a decision point in the process. Typically, the statement in the symbol will require a ‘yes’ or ‘no’ response and branch to different parts of the flowchart accordingly.
![]()
![]()
Circle – use it to represent a point at which the flowchart connects with another process. The name or reference for the other process should appear within the symbol.